Some 40 years ago, I was undertaking some research for the EEC and my job was to analyse apple, pear, peach and apricot yields and assess the optimal age of an orchard. It does look a slightly strange task when you see it written down but there was a good reason for it. Many orchards in Europe at that time were old and fairly non-productive. The EEC wanted to assess what the optimal age was for an orchard so they could encourage farmers to have a cycle of replenishment for their trees.
The answer was about 10-20 years, whereas many orchards were much older than that. Beyond that range, the productivity fell and the proportion of effort required to maintain the trees increased, both in terms of labour costs and chemical input. So this was a way not only to improve productivity, but also benefit the environment.
The answer was about 10-20 years, whereas many orchards were much older than that. Beyond that range, the productivity fell and the proportion of effort required to maintain the trees increased, both in terms of labour costs and chemical input. So this was a way not only to improve productivity, but also benefit the environment.
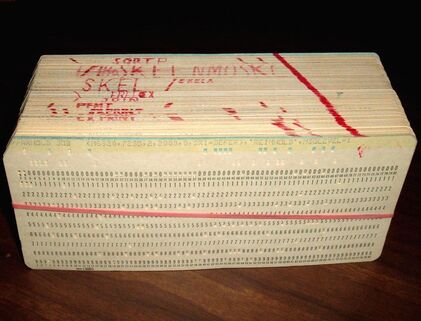
The reason for mentioning this now, is that to go from the boxes of hand-written notes to an answer, meant transferring all the data onto punchcards, carrying them in a stack across to the computer building (yes, building….) and then waiting until the next morning to see if my program had worked.
It was one of those skills I didn’t know I would need until it suddenly presented itself, but in the end it proved to be a fun project.
It was one of those skills I didn’t know I would need until it suddenly presented itself, but in the end it proved to be a fun project.
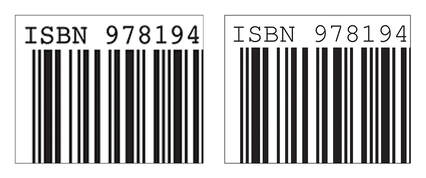
More recently, I discovered another skill that I needed. I wasn’t really happy with my early attempts at producing stitch diagrams on a computer. They looked great at a regular viewing size, but if you really zoomed in to see the details then they just started to look fuzzy, as you can see in the photo on the left, which is a standard "jpg" picture.
However, that was before I learned about “Vector Diagrams” and if you’ve never heard of them before, then don’t worry – I hadn’t either! However, once I tried the first stitch diagram out as a Vector Diagram then I could see how much better they were. Just look at the crisp diagram on the right!
However, that was before I learned about “Vector Diagrams” and if you’ve never heard of them before, then don’t worry – I hadn’t either! However, once I tried the first stitch diagram out as a Vector Diagram then I could see how much better they were. Just look at the crisp diagram on the right!
So when we were drawing up the stitch charts for our new Reversible Knitting Stitches E-book, I wanted to use this method. And I am so pleased I did, as you can really zoom in to see the details. Even at quite a magnification, the charts stay beautifully crisp and clear.
Many thanks again for all the lovely comments on our book. We are so pleased everyone is enjoying the book so much and finding it useful for their own designing work.
Next time, I’m going to post some more of my husband Tim’s lovely photos. We’ve been driving through North Carolina and his photos are stunning. So please join me then.
Until then – Happy Reversible Knitting!
Moira
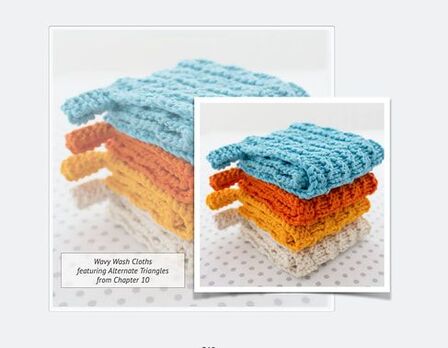
Last Blogpost: Two new beanie hats Next Up: It’s Knitting Time Our book: Reversible Knitting Stitches My Website: www.wyndlestrawdesigns.com Top photo: This shows Anna's "Wavy Wash Cloths" which use a beautifully textured stitch from our Reversible Knitting Stitches book. |
Keywords: Book/Reversible Knitting Stitches,
stitch charts, software, charting software, E-book,
stitch charts, software, charting software, E-book,


